← Projects

Data Science · Completed case study

Retail Sales Exploratory Analysis

A small transaction dataset becomes a disciplined exercise in data quality, statistical reasoning, customer behaviour and honest interpretation.

  • Python
  • Pandas
  • Statistics
  • Data visualization

01 / Purpose

From raw transactions to evidence that can be questioned.

The aim was not to decorate a dataset with charts. It was to build a traceable analysis in which every result follows from a stated decision.

The project examines 281 retail transaction records across one month. It validates the data, handles missing sales transparently, studies the distribution of transaction values, tracks daily activity and measures customer contribution.

Analytical principle Report what the data supports—and make the boundaries of that evidence visible.

02 / Questions

Six questions guided the analysis.

  1. 01

    Is the dataset complete, internally consistent and suitable for analysis?

  2. 02

    What do the centre, spread and shape of transaction values reveal?

  3. 03

    How do daily sales and transaction volume change across the month?

  4. 04

    Which observed customers contribute the most recorded sales?

  5. 05

    How is daily sales performance associated with transaction volume?

  6. 06

    Which conclusions are supported—and which would overstate the evidence?

03 / Method

A reproducible path from data to interpretation.

Each stage produces evidence used by the next.

  1. 01Validate

    Check fields, types, identifiers and missingness.

  2. 02Prepare

    Parse dates and preserve the original data.

  3. 03Summarise

    Build transaction, daily and customer views.

  4. 04Visualise

    Inspect patterns, spread and influential values.

  5. 05Interpret

    Separate observation from inference.

Complete sales values98.6%
277 of 281 records

04 / Data quality

Missing revenue was excluded—not invented.

Four transactions have no sales amount. They are excluded from revenue calculations rather than filled with the mean, because imputation would manufacture sales that were never observed.

  • 0 duplicate rows
  • 0 duplicate transaction IDs
  • 0 missing customer IDs
  • 4 missing sales values

Decision: preserve the raw file, analyse complete sales records, and report the exclusion explicitly.

05 / Explore the month

Daily activity, one day at a time.

Selected day

22 September
1,147.62 total sales15 transactions · 76.51 average

Select or focus a bar to inspect that day. Switch the measure to compare sales value with transaction volume.

06 / Findings

What the observed month reveals.

Each finding is paired with the qualification needed to interpret it responsibly.

01

A right-skewed transaction distribution.

The mean transaction value is 56.13, while the median is 36.28. A smaller group of high-value purchases pulls the mean upward, so the median better represents a typical transaction.

IQR upper fence185.366 high-value observations · 7.6% of sales

Interpretation: the six observations were retained because no available field indicates that they are data-entry errors.
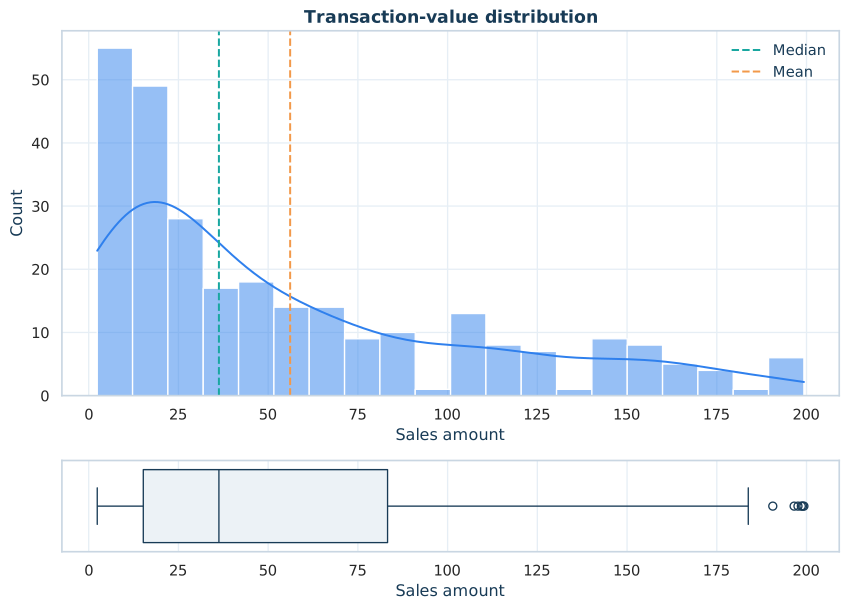
Histogram and box plot showing a right-skewed distribution of transaction sales values
Distribution of the 277 complete transaction values.
02

Daily performance varies substantially.

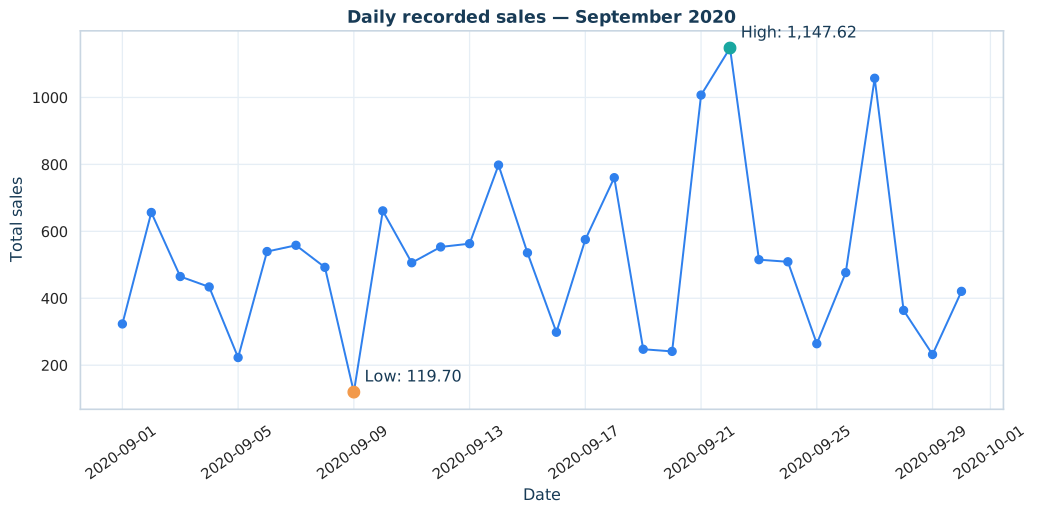
Recorded daily sales range from 119.70 on 9 September to 1,147.62 on 22 September. The average daily total is 518.25.

Highest day22 September1,147.62 across 15 transactions

Interpretation: one month can describe variation, but it cannot establish seasonality or support dependable forecasting.

Line chart of total daily sales during September 2020
Daily totals across the 30-day observation window.
03

Customer contribution is distributed.

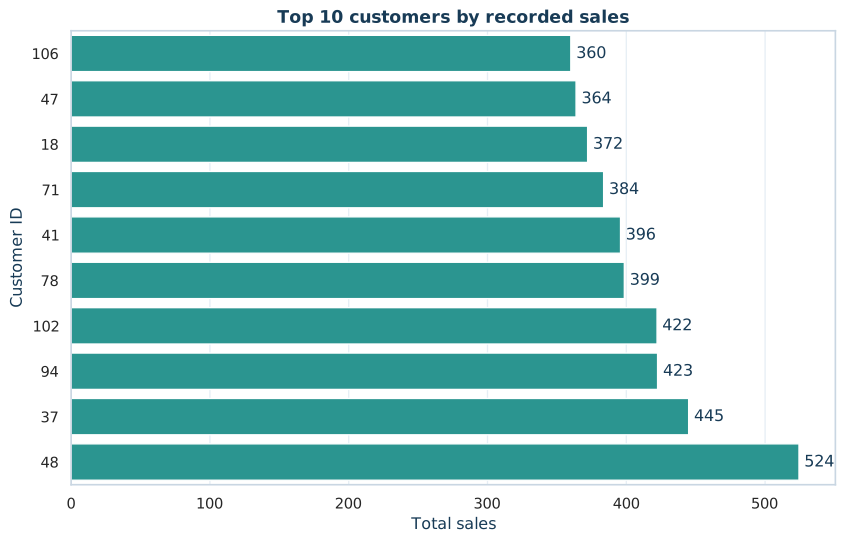
Customer 48 generated the highest recorded sales: 524.41 across four transactions. The top ten customers account for 26.3% of the month’s total.

Repeat within month74.4%of customers · 87.0% of recorded sales

Interpretation: this is repeat activity inside September, not a long-term retention rate.

Horizontal bar chart showing the ten customers with the highest total recorded sales
Top customers ranked by total recorded sales.
04

Sales rise with transaction volume—but cautiously.

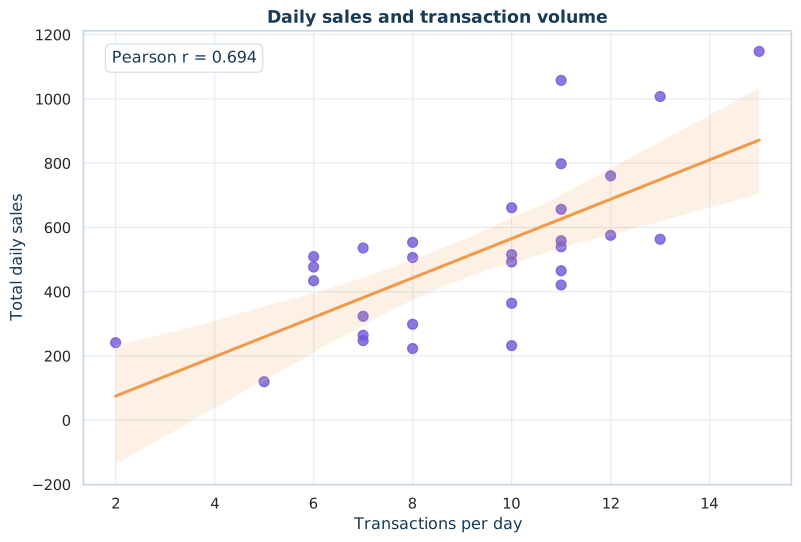
Daily transaction count and total daily sales have a Pearson correlation of r = 0.694, a moderately strong positive association.

Pearson correlation0.694daily total sales × daily transaction count

Interpretation: daily sales is the sum of transaction values, so transaction count is mechanically part of the outcome. This is not causal evidence.

Scatter plot showing the positive association between daily transaction count and total daily sales
Daily transaction volume compared with total sales.

07 / Statistical perspective

Point estimates need a measure of uncertainty.

A 10,000-sample percentile bootstrap estimates plausible ranges without assuming that the strongly skewed transaction values are normally distributed.

Mean transaction56.13

95% bootstrap interval

50.04 — 62.45
Median transaction36.28

95% bootstrap interval

26.09 — 45.53

08 / Data

Four fields—and clear analytical boundaries.

The compact structure is enough for transaction, daily and customer-level exploration. It is not enough for product, profitability or geographic analysis.

Retail sales dataset fields
FieldTypeMeaning
customer_idIntegerAnonymised customer identifier
transaction_dateDateDate of the transaction
transaction_idIntegerUnique transaction identifier
salesNumericSales amount; currency not specified

09 / Boundaries

What this project does not claim.

Time

One month cannot establish seasonality, trends or forecast reliability.

Business detail

No product, category, channel, location, cost or profit fields are available.

Customer history

Activity inside September cannot establish acquisition, churn or long-term retention.

Provenance

The original source, sampling method and currency were not documented in the earlier dataset.

Recommended next dataset

At least 12 months of transactions with product, category, store or channel, quantity, price, discount, cost and customer-acquisition fields—enabling seasonality, profitability, cohorts, segmentation and forecasting.

10 / Reproduce the work

The complete analysis remains open and inspectable.

The repository contains the dataset, guided notebook, reusable Python analysis, generated figures, summary tables and machine-readable results.

terminal
$ git clone https://github.com/
  DrHiraBenish/sales-data-analysis.git

$ pip install -r requirements.txt
$ python src/analyze_sales.py

✓ Reports regenerated successfully.